

Traditional search queries bury users in information they already know. VALUENEX Radar enables people to see outside their information bubble into the greater data landscape, empowering them to explore data with purpose.
The Radar Explained.
ALWAYS MORE THAN MEETS THE EYE
VALUENEX Radar Documents
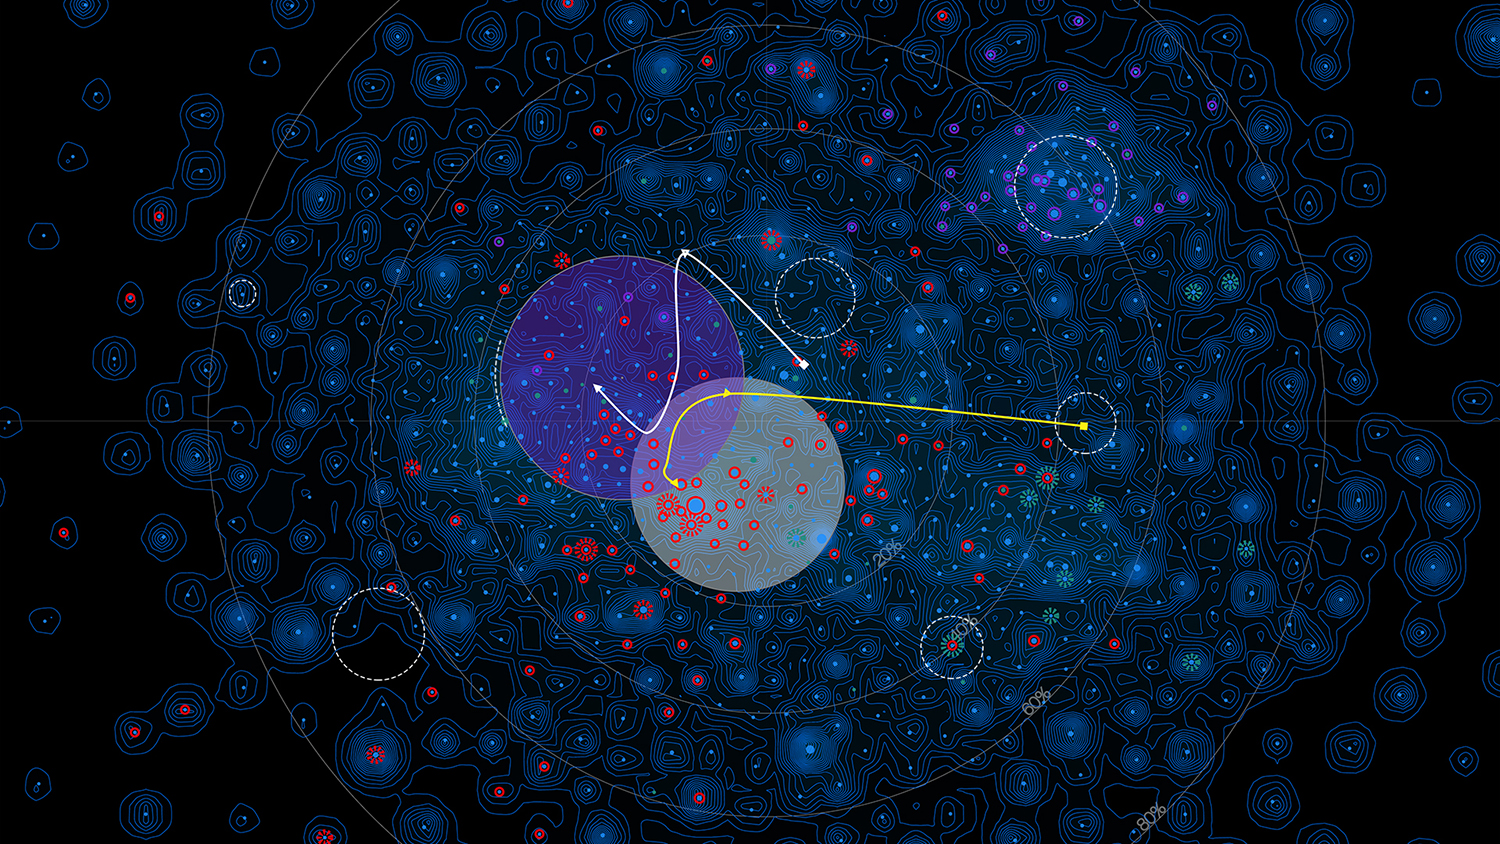
DATA: 7,804 ‘Robotic Surgery’ Research Papers • SOURCE: PubMed
RADAR SETTINGS: Default
Analyze & Visualize your Data.
Make sense of vast quantities of your own data to gain insight into previously unseen patterns and future movements, allowing for detection and extraction of key knowledge such as untapped potential, new opportunities, competitive threats, and collaborative links to make better decisions for future strategy.
Upload up to 200,000 documents per analysis in English, Japanese or Chinese, and connect insight to innovation.
Perform Multi-layer Analyses for Comprehensive Intelligence.
Upload and analyze any type of compiled text, such as start-up data, scientific papers, news, financial reports, customer feedback, or anything else you can think of. Dive deep and pinpoint any part of any document within the landscape for targeted extraction, or use the big picture to discover white space.
Fully customize the output visualizations for optimized understanding of the next steps, and create the bridge between knowledge and action.
DATA: 1,118 ‘Smart Home & City’ Company Profiles • SOURCE: Crunchbase
RADAR SETTINGS: Heat map at mid-contrast, cluster layer off
When we say any kind of compiled text, we mean it.
DATA: 14,622 Tweets • SOURCE: Twitter
RADAR SETTINGS: Dark mode, heat map at low contrast, cluster layer off
CASE IN POINT


VALUENEX Radar Patents
DATA: 3,932 EPO patents with IPC H01M • SOURCE: European Patent Office
RADAR SETTINGS: Default
Gain Strategic Intelligence through Deep Analytics of In-built Patent Data.
Perform panoramic analyses with USPTO, EPO, WIPO, and JPO data by concept, bibliographic data, or patent numbers. Target specific technologies, methodologies, companies, and pan-industry movements for strategy planning.
Clear Insight from the Big Picture + Adaptive Data Lists.
Identify highly relevant areas within the landscape and instantly jump into detailed technology breakdowns that adapt based on custom filters and targeted data points.
Understand a company's position compared to others and hone in on specific technologies, patents, inventors, assignees, and more to discover competitive threats, technology convergence, synergy opportunities, and the evolution of R&D trends of a portfolio or field.
DATA: 3,932 EPO patents with IPC H01M • SOURCE: European Patent Office
RADAR SETTINGS: Default
Map technological evolutions and trends of any company, product, or industry.
DATA: 11,108 US patents of Amazon and Facebook • SOURCE: USPTO
RADAR SETTINGS: Full screen mode, cluster layer off
CASE IN POINT


SCOPE
DATA: 1,000 US patents related to ‘electric vehicle’ • SOURCE: USPTO
RADAR SETTINGS: Default
Straight to the Point.
Get an instant understanding of where technology, companies and key people are with the competitive analysis.
Add, remove, or change word combinations to have the radar and adaptive list update based on specific objectives.
Run Quick Analyses and Prior Art Search.
Retrieve up to 1,000 USPTO, EPO, WIPO, or JPO patents for a fast overview of where companies are filing within a field, what technological relationships are, and pinpoint locations of patents or concepts for prior art search.
DATA: 1,000 US patents related to ‘electric vehicle’ • SOURCE: USPTO
RADAR SETTINGS: Default
Unlock the power of data and enable insight
backed by machine intelligence.
backed by machine intelligence.